Prompts Report
On the Reports tab, the Prompts reports allow teachers to see which prompts are being used and how well students are performing.
Prompt Analysis Report
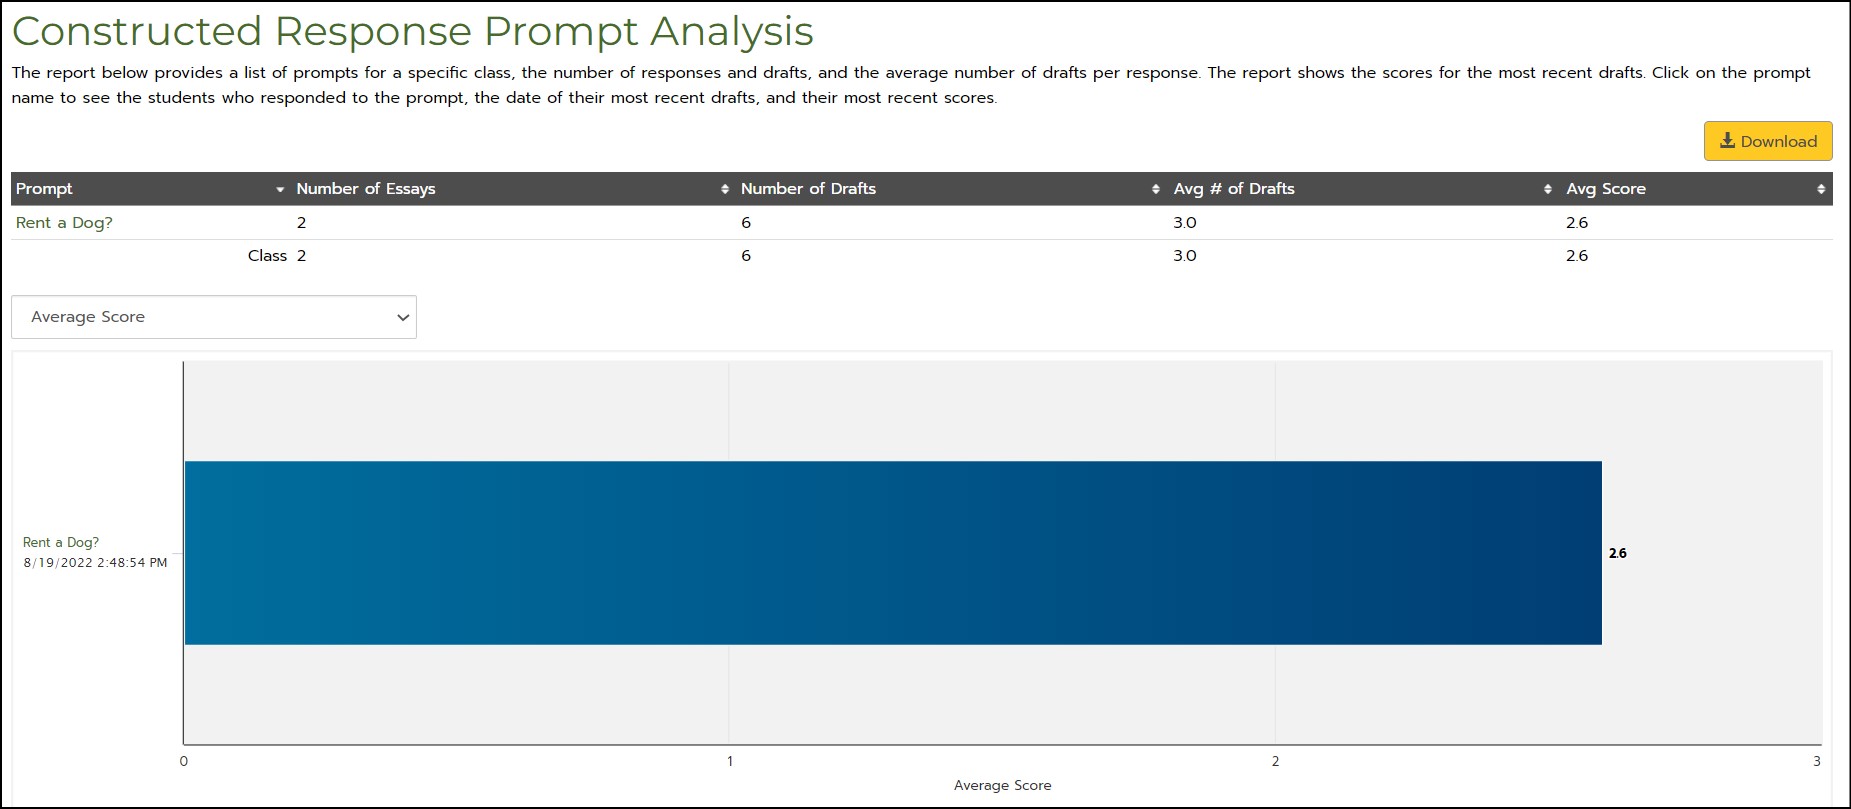
The Prompt Analysis report displays all the prompts to which your students have written. It includes useful information such as number of essays, number of drafts, and the average trait and total scores for each prompt. The averages are based on students’ most recent drafts.

The chart below the table displays the average scores for each prompt.
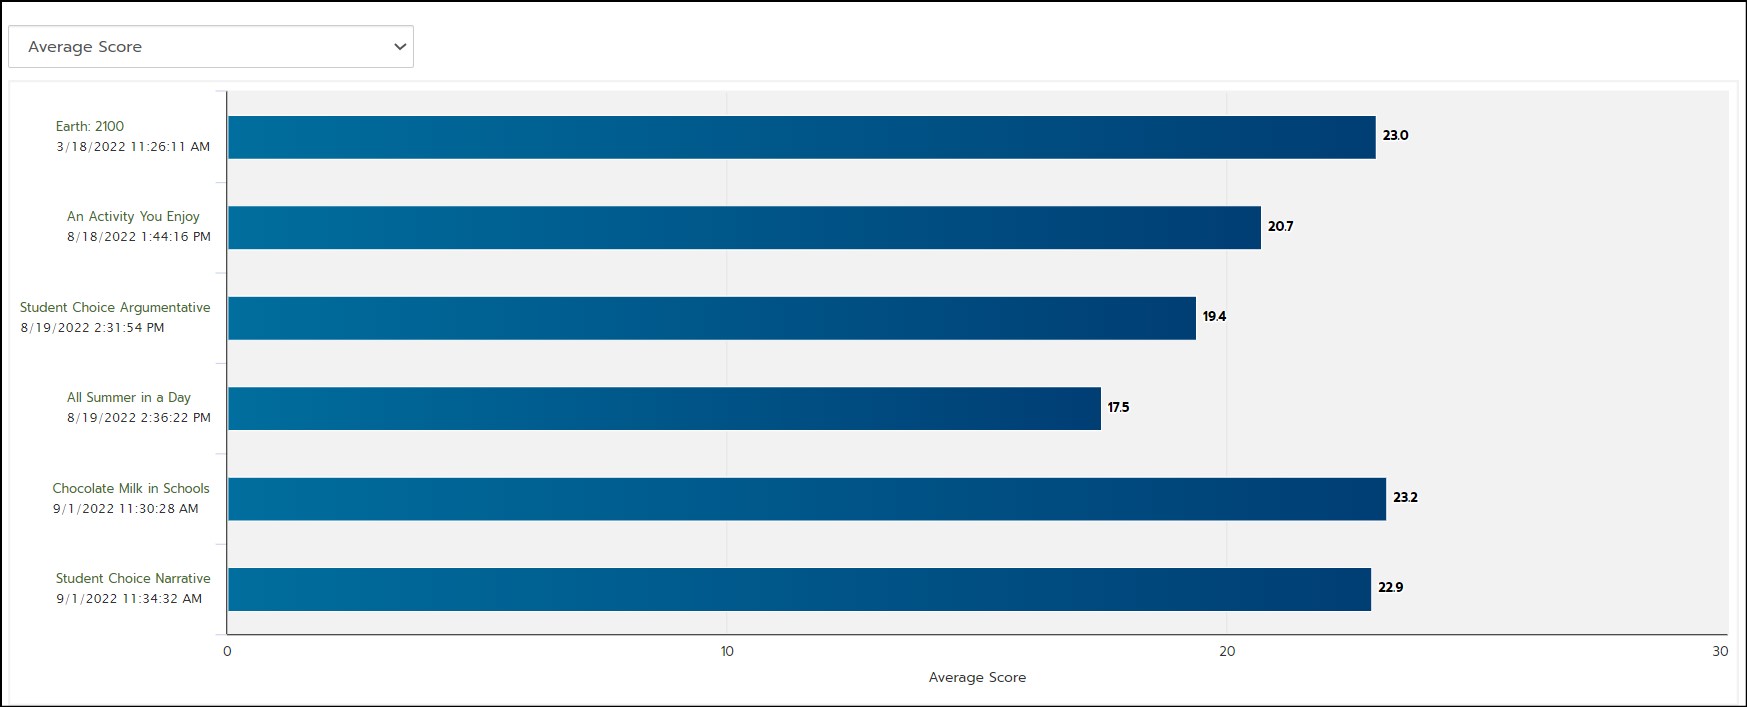
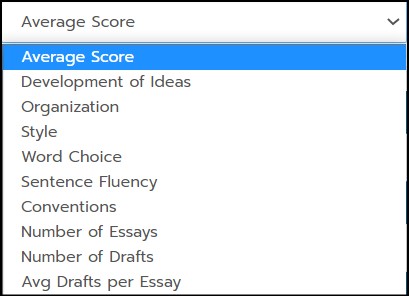
- Use the drop-down menu at the top of the chart to select the class data to be displayed for each prompt.
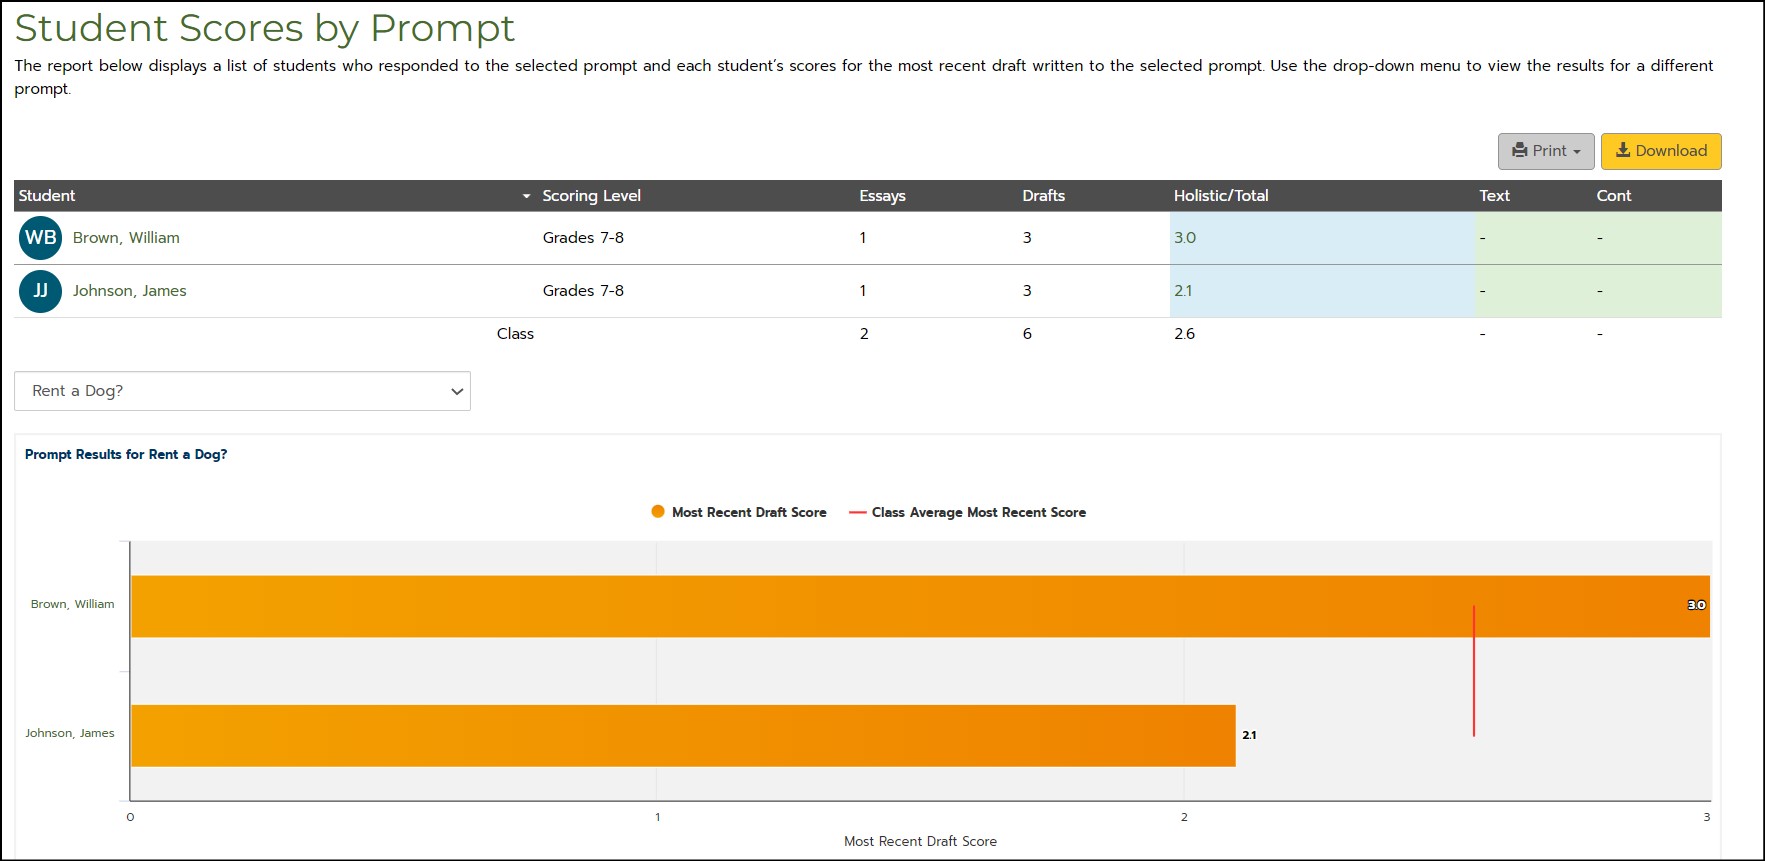
Click on a prompt title in the Prompt Analysis chart or table to view Student Scores by Prompt. The report shows the average total score, trait scores, and textual evidence and content accuracy scores, if given, for each student who has written an essay for the prompt. The number of essays written and the number of drafts submitted is also shown.
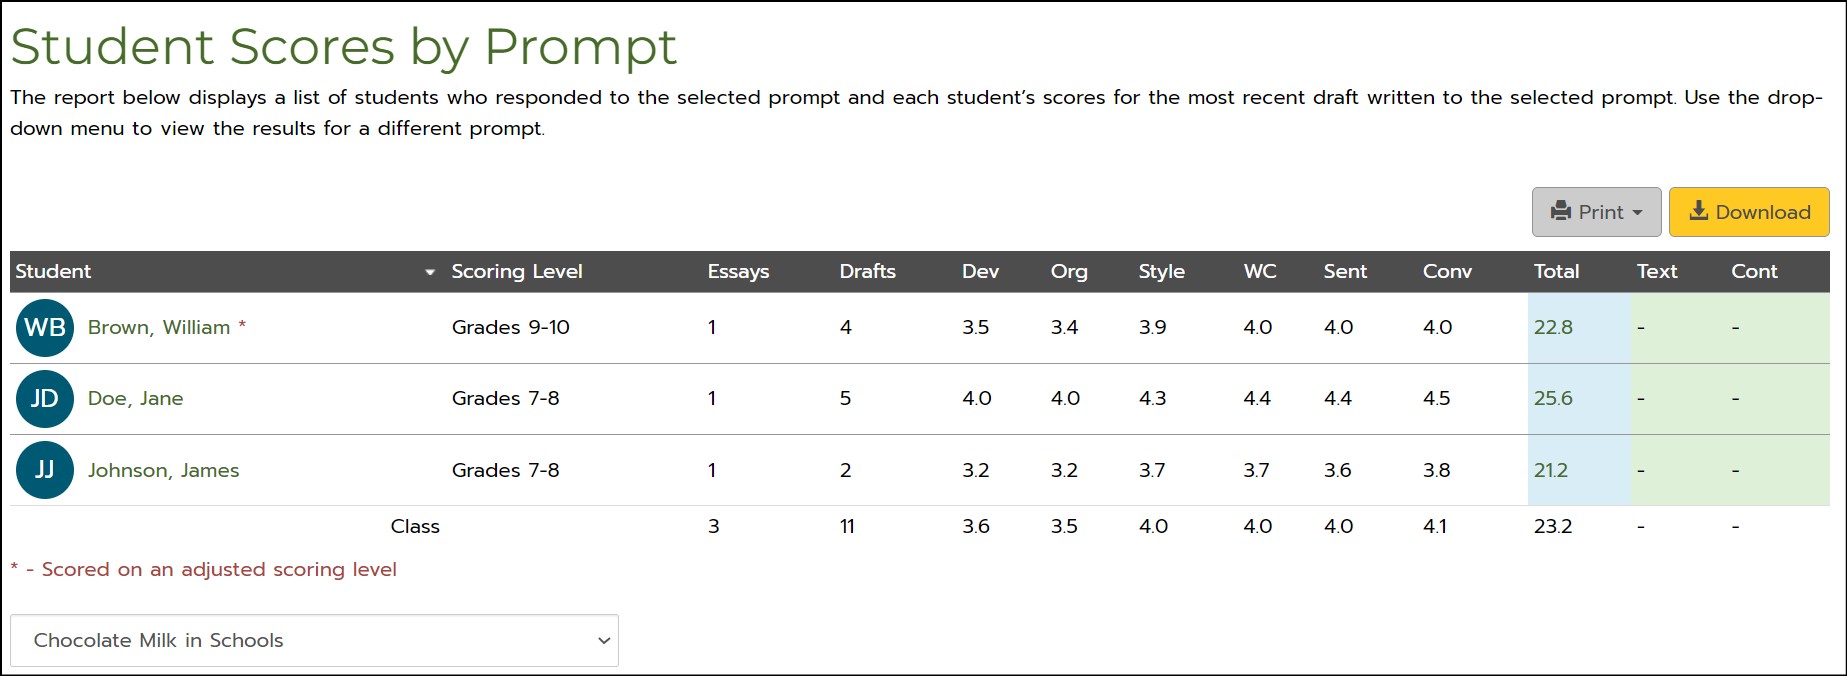
- Click on a student’s name in the table to display that student’s Score Report for the prompt.
In the chart below the table, the red Class Average line allows you to compare individual student scores to the class average score for the prompt.
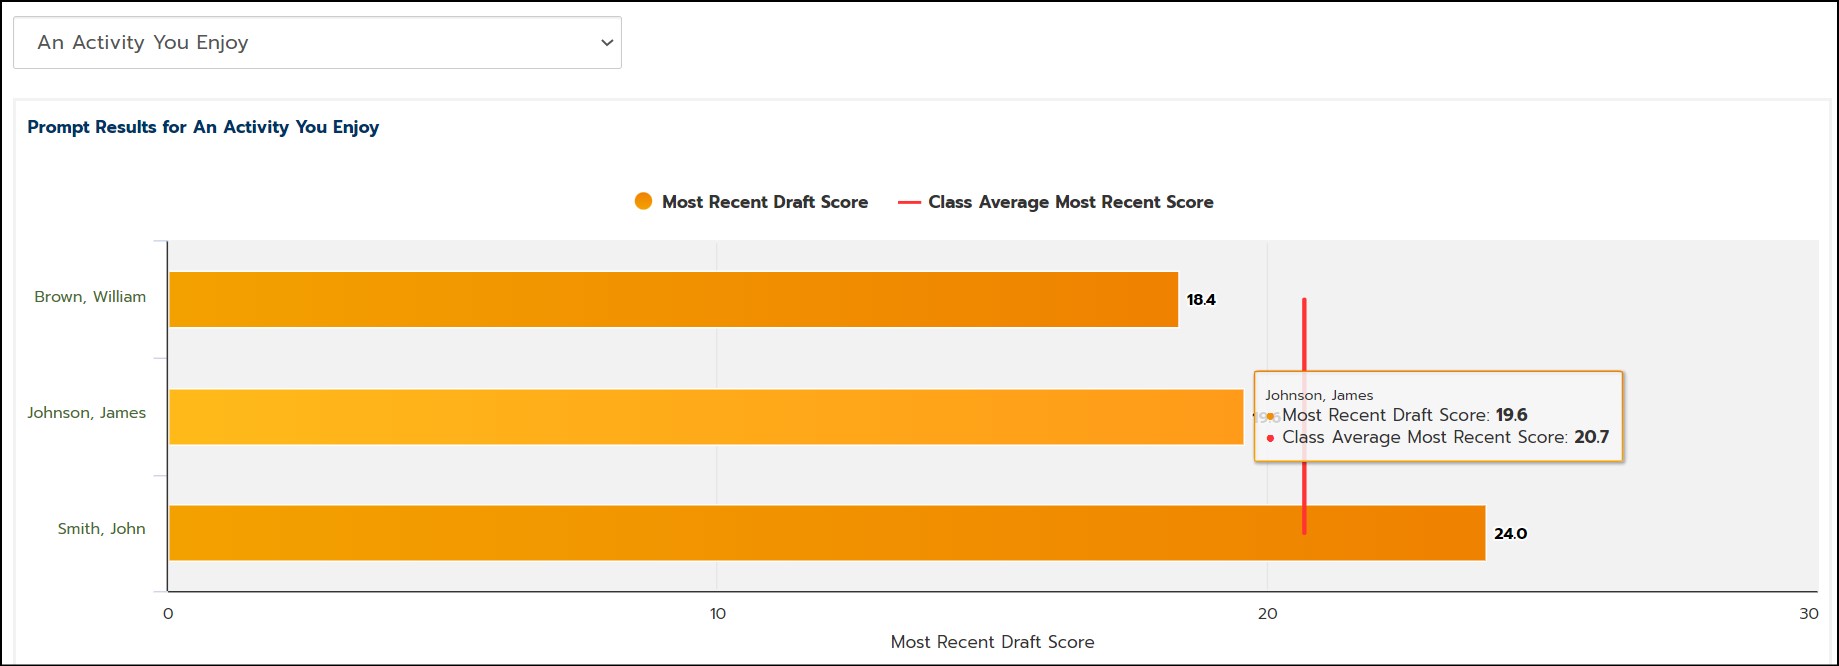
- Click on a student’s name in the chart to display the individual student’s scores on all prompts to which the student has written responses.
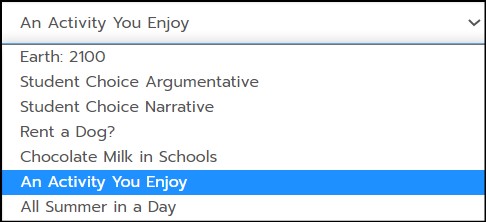
- Use the drop-down menu above the chart to select a different prompt and view students’ scores on their most recent draft submissions for that prompt.
The Constructed Response Prompt Analysis report shows the number of responses and drafts and the average number of drafts per constructed response. The average scores are for the most recent drafts. The scores are based on a three-point rubric.
- Click on the name of a prompt to see the scoring details for students who responded to the prompt.
- Use the drop-down menu above the chart to choose a different prompt.
- Click on a student name to display individual student scores.
Click Print to print a report or click Download to export a customizable report.

