
Understanding Performance Reports - Video
Tutorial
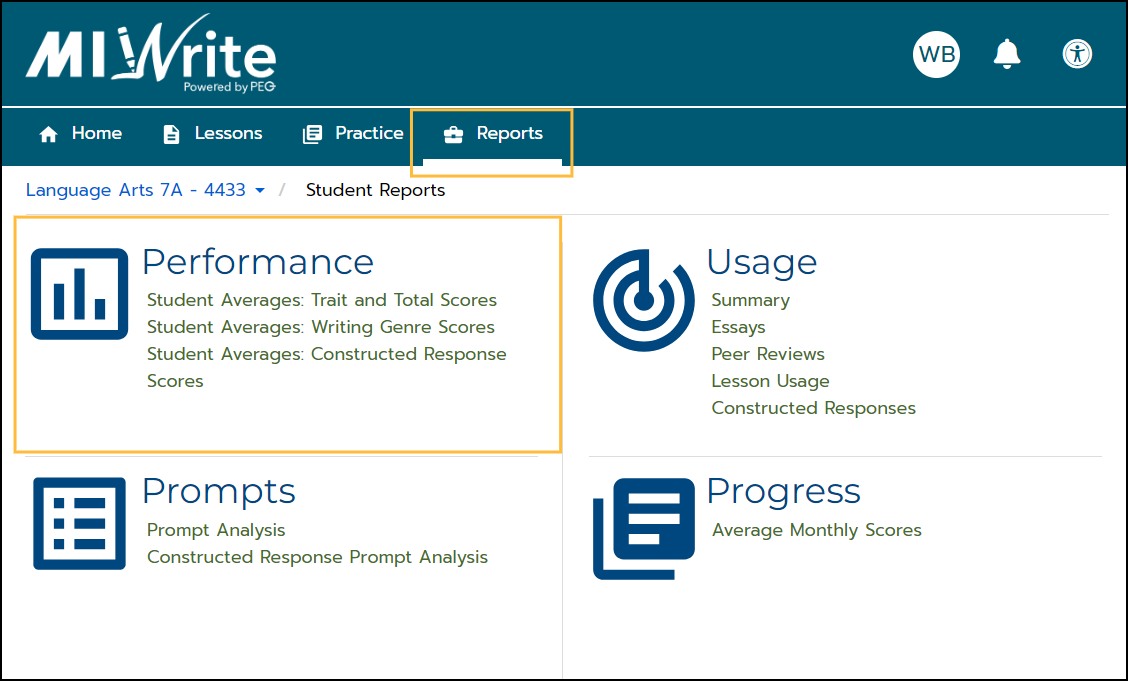
On the Reports tab, the Performance reports allow you to keep track of your essay scores by trait and total score and by writing genre, as well as by constructed responses.
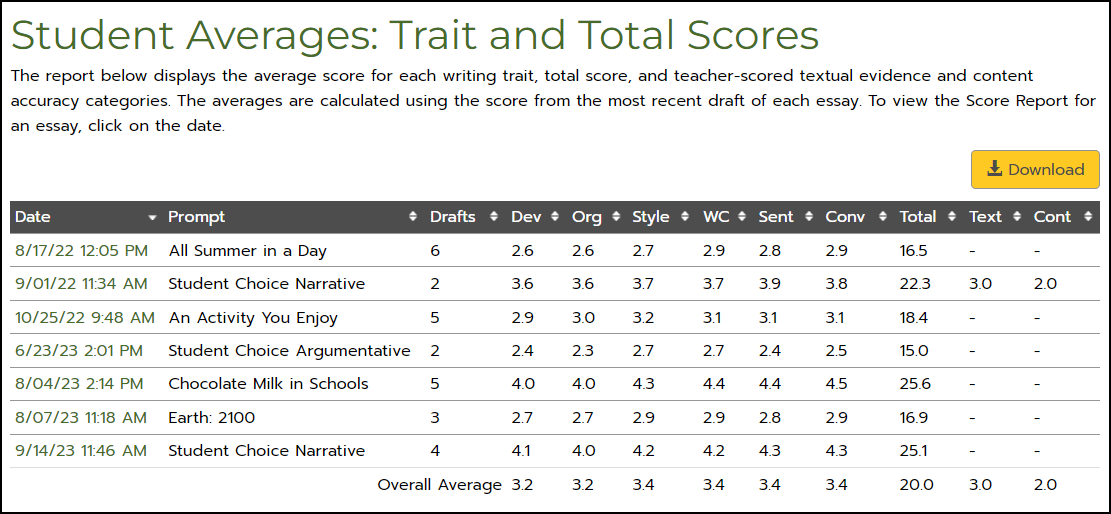
Student Averages: Trait and Total Scores
The Trait and Total Scores report displays the score for each of the six writing traits, the total score, and teacher-scored textual evidence and content accuracy scores, if given. The total scores are based on five possible points for each of the six traits, with a maximum of thirty points total.
Below the table, the score data are shown in a chart.
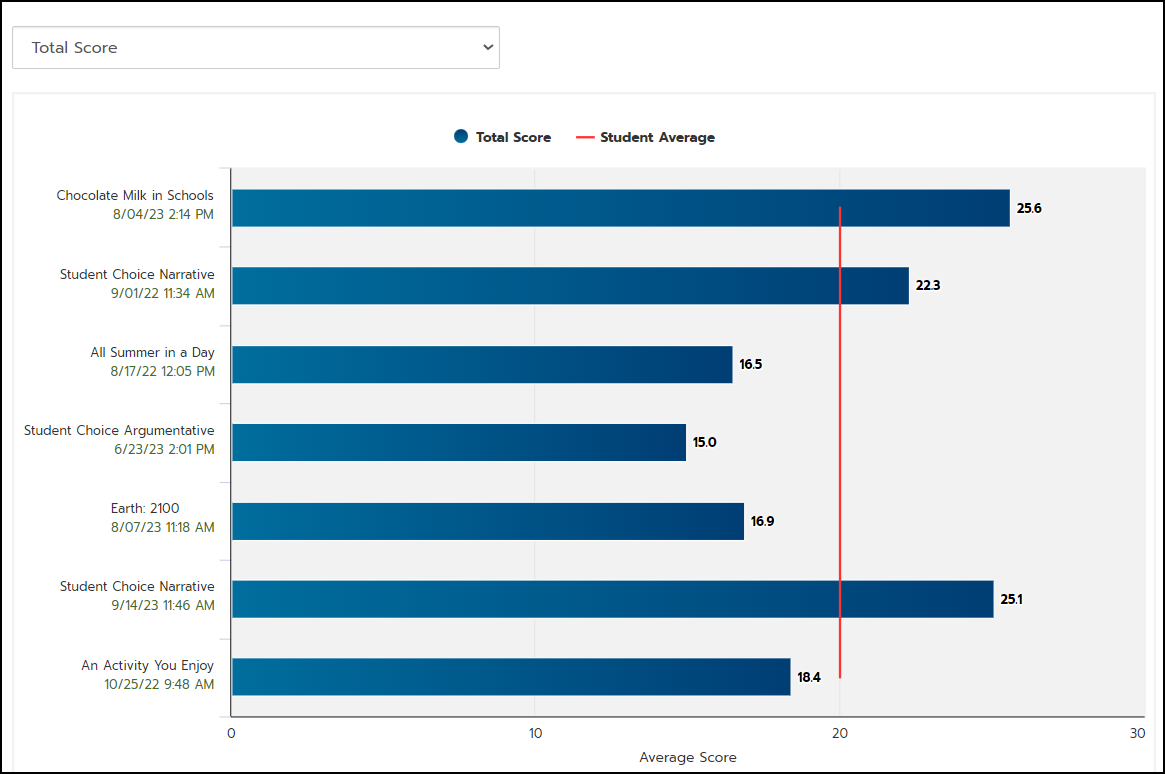
- The vertical red line indicates your average total score. Hovering over the blue bar for each essay, you can see how the scores compare to your average total essay score.
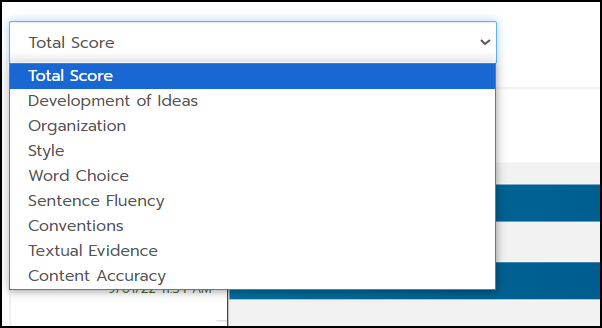
- You can filter the data displayed in the chart by clicking on the drop-down menu above the chart and selecting a category, such as a specific writing trait.
- To view your Score Report for a particular prompt, click on the date in the table or chart.
Student Averages: Writing Genre Scores
The Writing Genre Scores report compares your scores on essays written in each specific genre of writing.
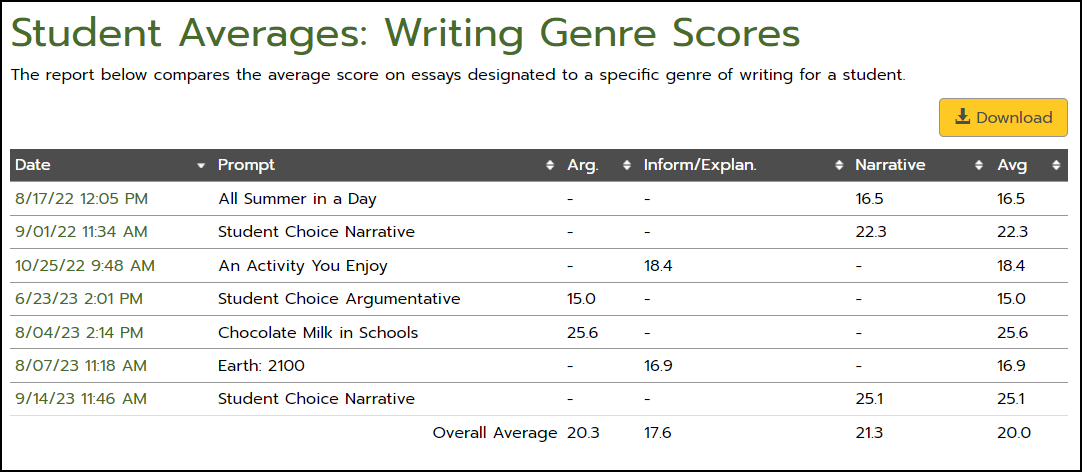
- To view your Score Report for a particular prompt, click the date in the table.
Below the table, the genre score data are shown in a chart.
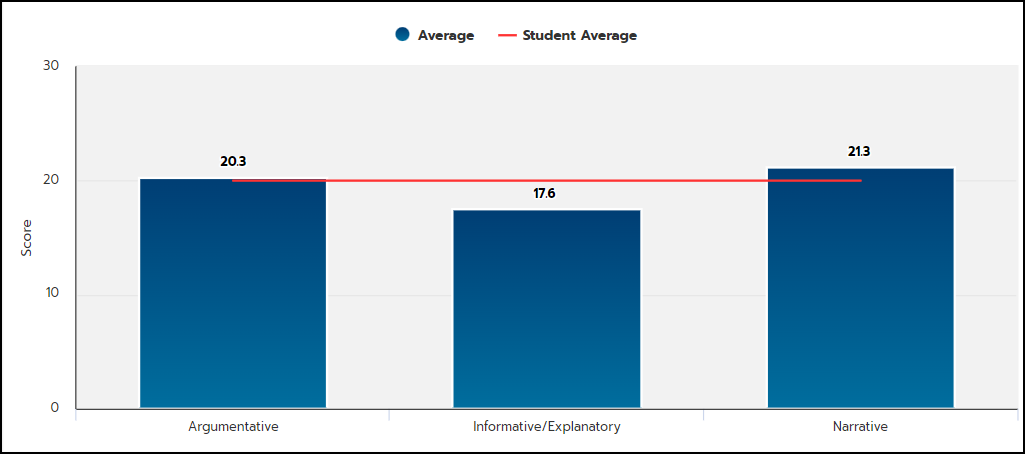
- The horizontal red line indicates your overall average essay score. Hovering over the blue bars, you can compare your average essay score in each genre to your overall average essay score.
Student Averages: Constructed Response Scores
The Constructed Response Scores report table displays your holistic score for each constructed response, as well as teacher-scored textual evidence and content accuracy scores, if given. Your overall average constructed response score is also displayed.
The chart below the table shows your constructed response scores compared to your overall average constructed response score, indicated by the vertical red line.
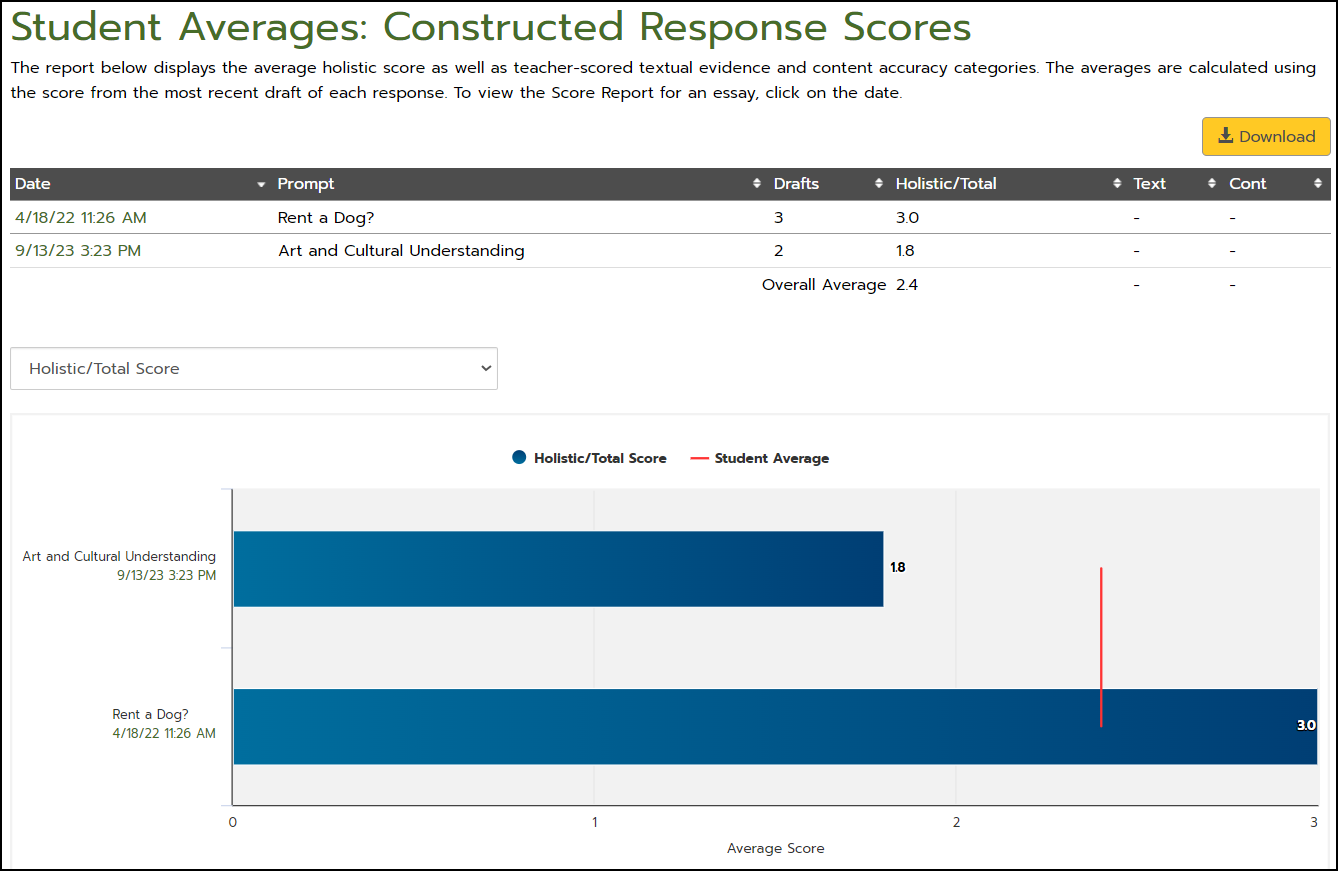
- You can filter the data displayed in the chart by clicking the drop-down menu above the chart and selecting a category.
- Click on the date in the table or chart to display the Score Report.
Click the Download button to export a customizable report.